These examples of infographics, diagrams and research posters show the value of visual design in helping to communicate abstract concepts or complex information.

Diagram showing the organic process for my Master of Design research project
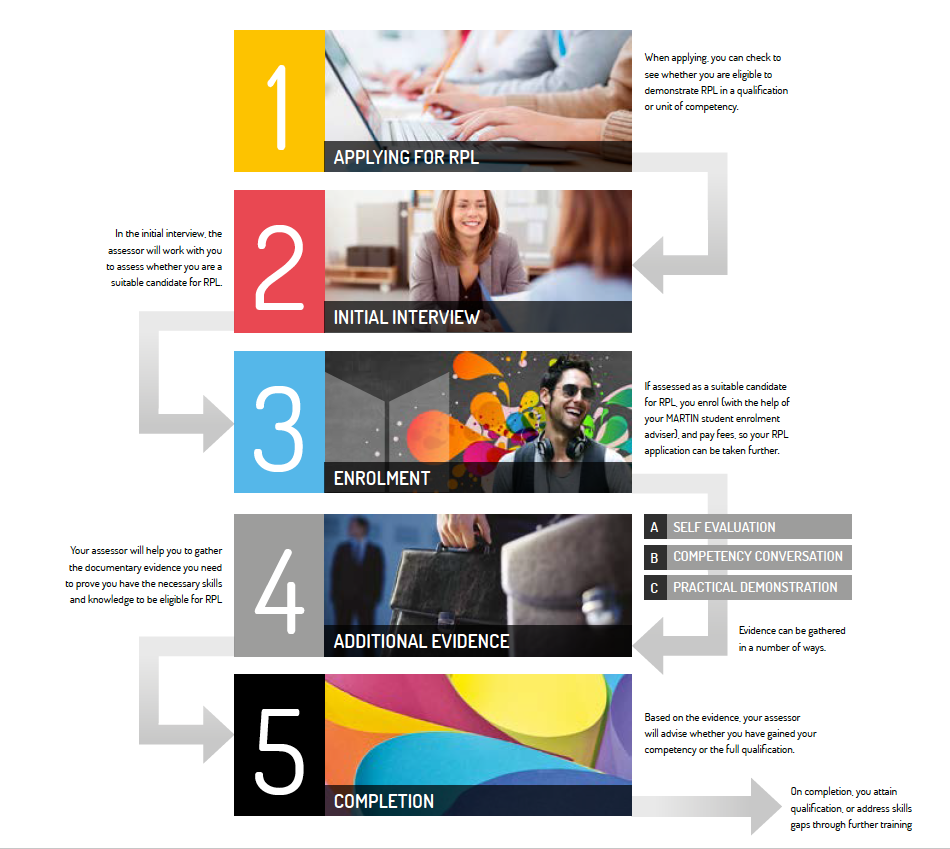
Diagram to give students an overview of the process of applying for RPL (Recognition of Prior Learning)
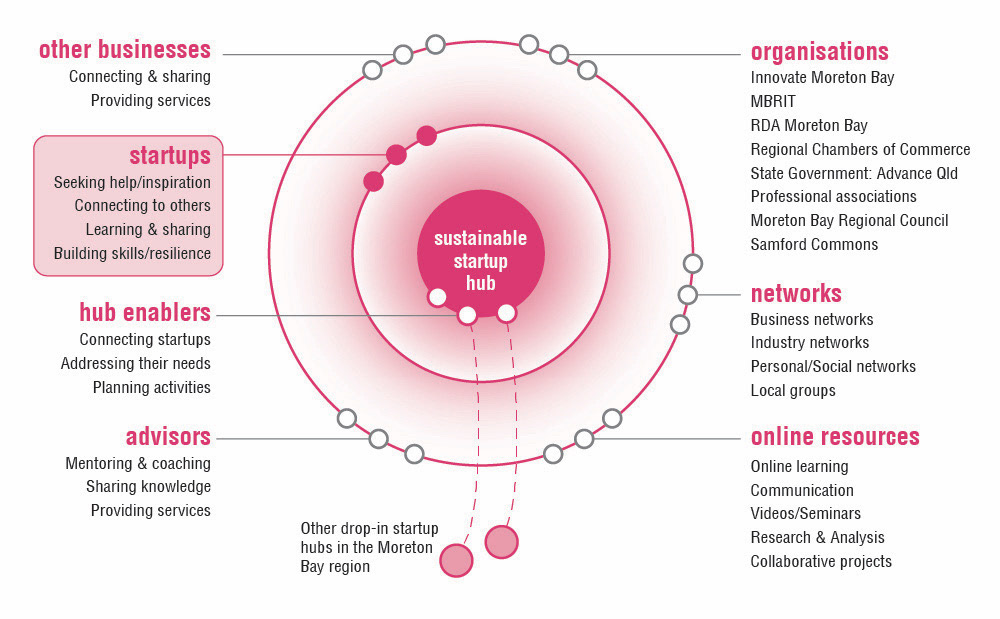
Diagram to show how the concept of a business start-up hub relates to other entities

Large A1 research poster summarising main stages of a Design Thinking project

Diagram showing the main strands of activity and predicted outcomes for a community project, Samford Commons
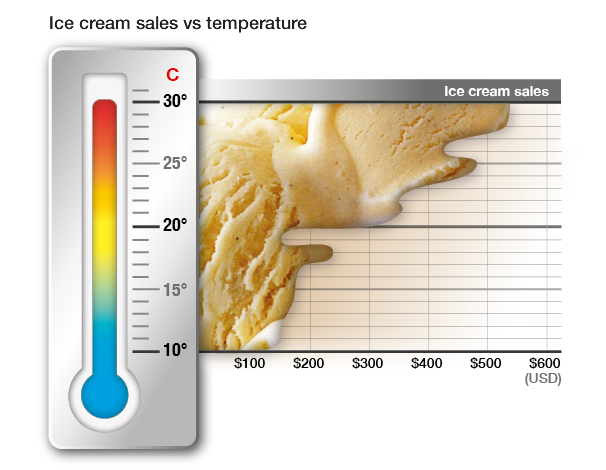
Infographic showing the relationship between ice cream sales and temperature

Poster to support a research project grant application - visualising the issue at the centre of the project.
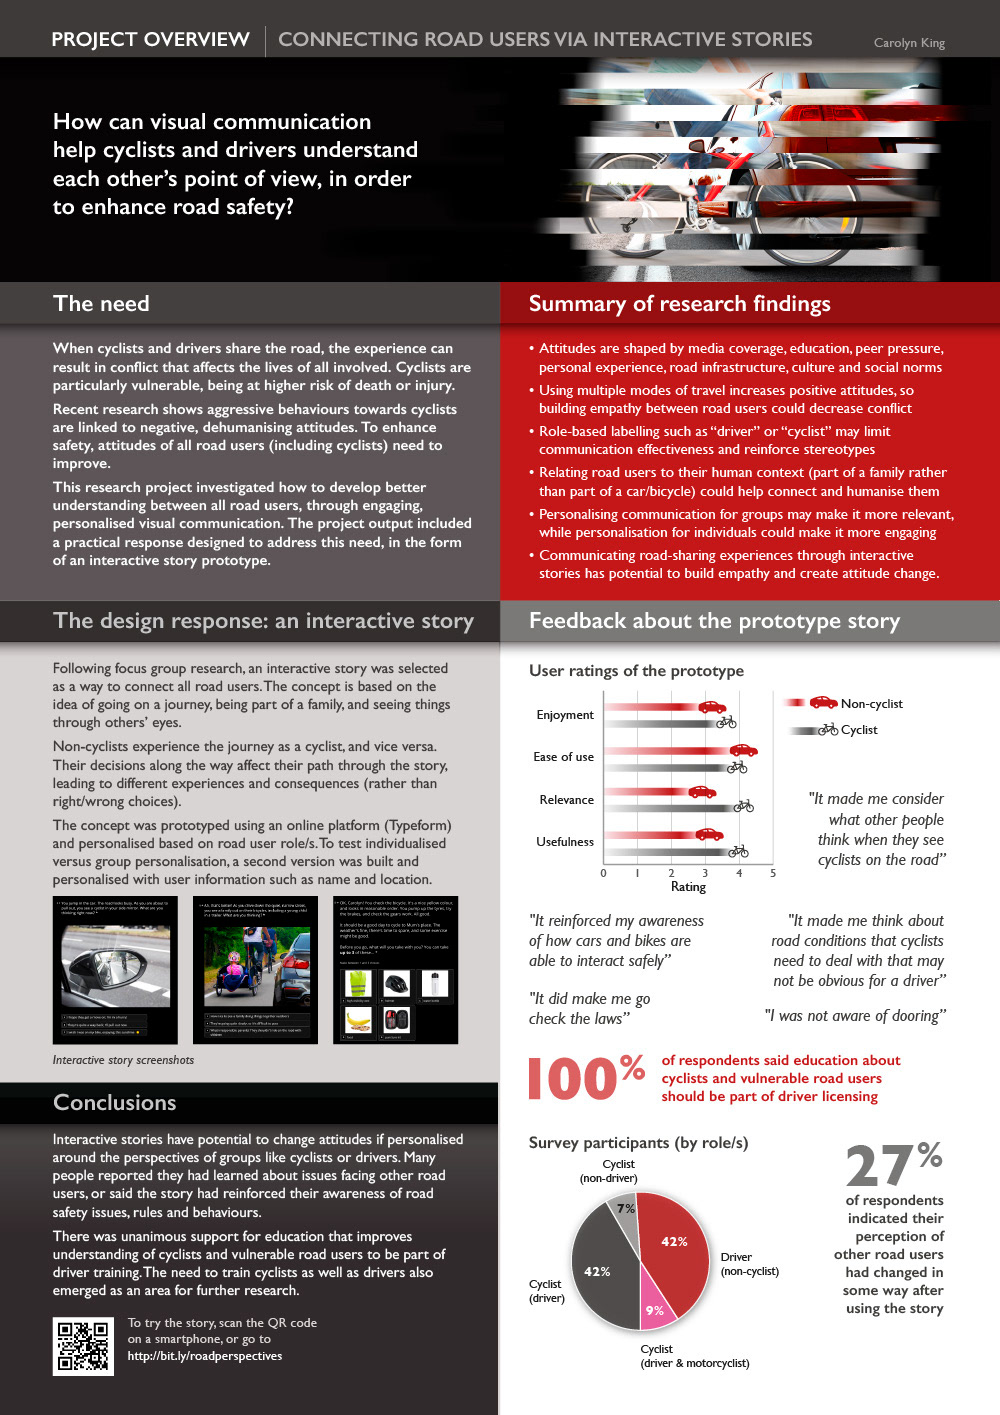
Research poster summarising project aims, process and findings (with simple infographics)